A SmartArt graphic is a visual representation of your information and ideas. You can create SmartArt graphics by choosing from among many different layouts to quickly, easily, and effectively communicate your message.
When you create a SmartArt graphic, you are prompted to choose a type such as Process, Hierarchy, Cycle, or Relationship. A type is similar to a category of SmartArt graphic, and each type contains several different layouts.
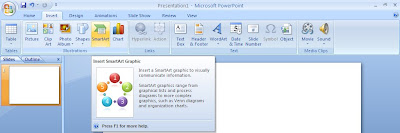
- Click insert then choose Smart Art
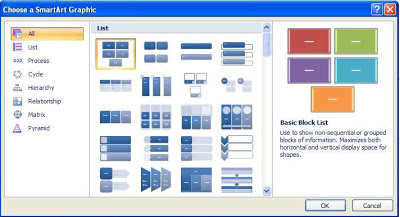
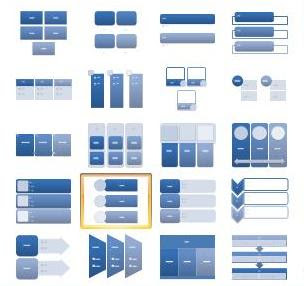
- You can choose various design layout.For exampleTo do this Use this typeShow nonsequential information : listShow steps in a process or timeline : ProcessShow a continual process : CycleCreate an organization chart : HierarchyShow a decision tree : HierarchyIllustrate connections : RelationshipShow how parts relate to a whole : MatrixShow proportional relationships with the largest component on the top or bottom : Pyramid
Then click ok
- You will show Text pane.The Text pane is the pane that you can use to enter and edit the text that appears in your SmartArt graphic. The Text pane appears to the left of your SmartArt graphic. As you add and edit your content in the Text pane, your SmartArt graphic is automatically updated — shapes are added or removed as needed.When you create a SmartArt graphic, the SmartArt graphic and its Text pane are populated with placeholder text that you can replace with your information. At the top of the Text pane, you can edit the text that will appear in your SmartArt graphic. At the bottom of the Text pane, you can view additional information about the SmartArt graphicWrite what you need.
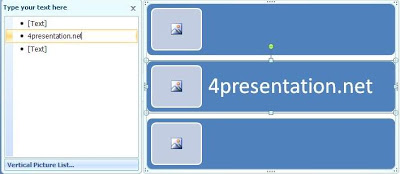
 Note : Depending on the layout that you choose, each bullet in the Text pane is represented in the SmartArt graphic as either a new shape or a bullet inside a shape.
 - Good luck